Introduction
Use this section to add a Visual report to LearnFlex. This process consists of a wizard that walks you through the required steps.
You can create multiple instances of the same report.
Note: The details displayed on each screen differ depending on the type of report that you are adding. The example below assumes you are adding the Top Enrollments report.
Procedure
1. From the Reports menu, select Visual Reports.
Note: This sub-menu is displayed when security setting 853: View Visual Report is enabled.
2. Click Add.
You will proceed to the first step of the wizard.
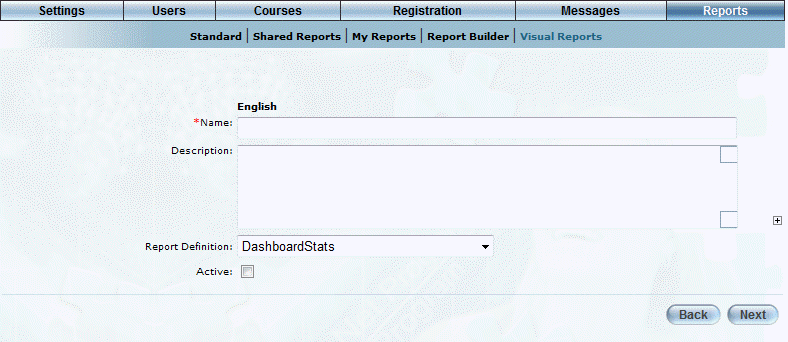
Step 1: Create Visual Report Instance
The Create a New Visual Report Instance screen is displayed:
Creating a Visual Report Instance
1. In the Name field, enter a unique name of the Visual report instance.
This value is required.
2. In the Description text box, describe the report that you are adding.
This description will be displayed to users in both Admin and User modes unless explicitly hidden.
3. Use the Report Definition drop-down list to select the type of report that you want to add.
In this example, Top Enrollments (Column) is being selected.
4. Check the Active box to indicate that you want the report to be available for display.
Note: To make the report available to users, you will also need to check boxes to indicate if you want the report displayed in User mode and/or Admin mode. Checking only this box will not display the report to users.
5. Click Next to proceed to the next step in the wizard.
Step 2: Select Criteria
The Criteria screen is displayed:
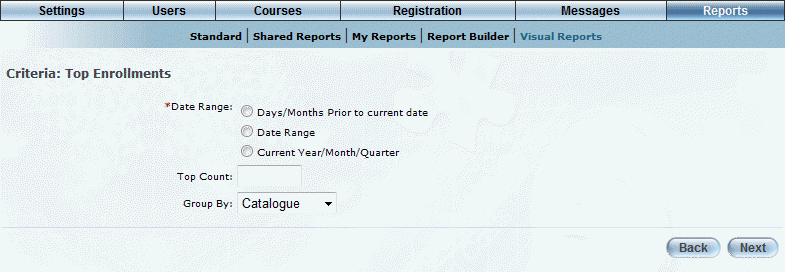
Criteria for a Visual Report
Note: The information on this screen depends on the report you selected.
Typically on this screen, you can select:
· Date range for a report
· The groups – such as target cohorts, catalogues, communities, business units, job positions - whose information you want to include in the report.
· The method of grouping report information.
For this example in particular:
1. In the Date Range section, select one of the following option buttons:
· Days/Month Prior to current date: Indicates that number of days or month prior to the current day that you want to include in the report. You will need to specify the actual number of days or months, up to a maximum of 999.
· Date Range: Allows you to indicate the start and end dates for the report.
· Current Year/Month/Quarter: Includes results for the selected year, month, or quarter, up to the current date.
2. In the Top Count field, enter the number of items to display.
For example, if you are reporting on catalogues, entering 20 in this field would return numbers for catalogues with the highest enrollments. This value is required.
3. Use the Group By drop-down list to indicate how you want results to be organized.
In this example, you can choose Catalogue, Subject, or Product Line.
4. Click Next to proceed to the next step in the wizard.
Step 3: Preview Visual Report Instance
You can preview the results of the report to make sure that it appears as needed. If not, you can change its parameters to make sure you get the results you want.
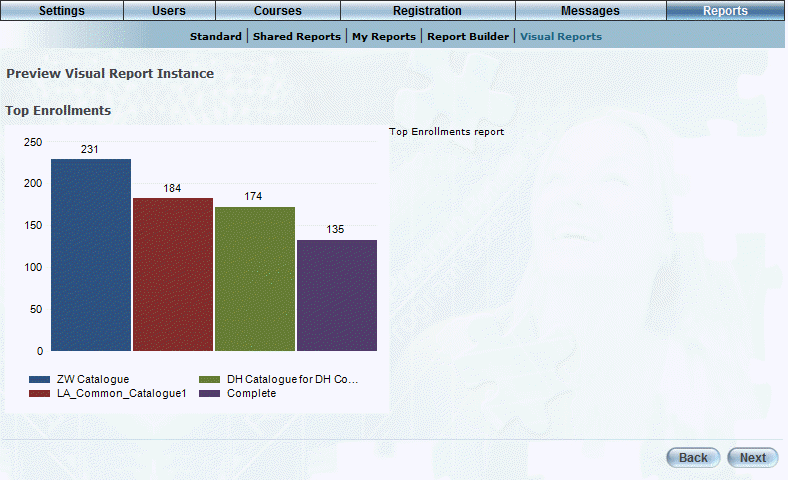
Previewing a Visual Report Instance
1. Assuming that you do not need to make any changes, click Next to proceed with the next step in the wizard.
Hint: When editing a Visual report, a + sign will be displayed above the Next button. Click this to display a text box that contains iFrame code for the selected report. You can copy this code into a Welcome page or as a resource link for users, for example.
Step 4: Specify Target Audience
An example of the Visual Report Target Audience screen is displayed:
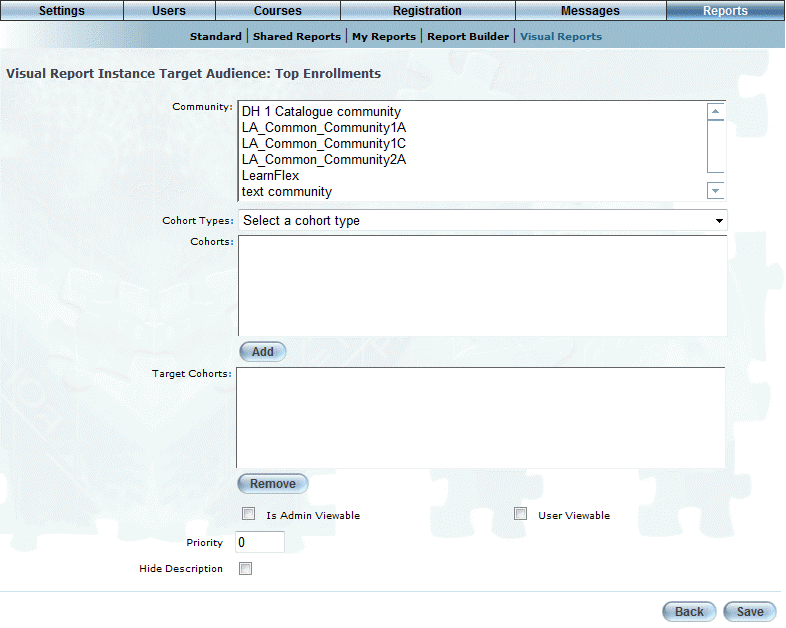
Specifying a Target Audience for a Visual Report
Use this section to specify those users who will be able to see this report. Among the aspects you can specify include:
· Communities that can access this report
· Cohorts that can access this report
· The mode (Admin and/or User) where this report can be seen
· The order of this report among other Visual reports
For this example:
1. Use the Community list box to select one or more communities who will be able to see this report.
Note: For users in the selected communities to see it, this report also has to be active and visible in Admin and/or User modes (explained below).
2. Use the Cohort Types drop-down list to select a cohort type.
This selection determines the cohorts that are displayed.
3. In the Cohorts box, select one or more cohorts that you want to be able to access this report.
4. Click Add.
The cohorts are moved to the Target Cohorts box.
Hint: To remove cohorts from accessing this report, select one or more from the Target Cohorts box and click Remove.
For all reports, you can specify the following aspects:
5. Check the Is Admin Viewable box to display the report within the Executive Dashboard.
6. Check the Is User Viewable box to display the report within the Visual Reports menu in User mode.
In the Dynamic Fields section:
7. Check the Is Dynamic User box to indicate that the criteria of the user that launches the report will be used instead of the criteria specified earlier in the wizard.
8. Check the Is Dynamic Community box to indicate that the community of the user that launches the report will be used instead of the community specified earlier in the wizard.
9. Check the Is Dynamic Org Unit box to indicate that the organizational unit (specified for a community) of the user that launches the report will be used instead of the organizational unit specified earlier in the wizard.
10. Check the Is Dynamic Job Position box to indicate that the job position of the user that launches the report will be used instead of the job position specified earlier in the wizard.
Note: The previous four check boxes will affect the report results only if the report in question uses the relevant criteria, otherwise the criteria specified previously will be used instead. See Types of Visual Reports for details about which reports use dynamic criteria.
11. In the Priority field, enter a number between 0 and 999999 to indicate how the report will be ranked in Admin and User modes.
A report having a higher number will be displayed before reports with lower numbers. Two reports with the same priority will be listed alphabetically. <
Reports that have no priorities assigned to them are listed in alphabetical order after those having a priority.
12. Check the Hide Description box to indicate that the description given to the report should be hidden from users in both Admin and User modes.
13. Click Save to keep your changes.
The report is now configured and can be viewed by applicable users in the selected mode(s).