Introduction
Use this report to list all attempts at a question, regardless if an answer was recorded or not. For each question, the report displays the question text and value as well as the average score, average percentage, and number of responses.
Note: Percentage grades on this screen are displayed according to the global grade precision setting.
Procedure
1. From the Reports menu, select Standard, then Assessment Reports.
2. Click the Question Report link.
Note: This link is displayed when security setting 304: Question Report is enabled.
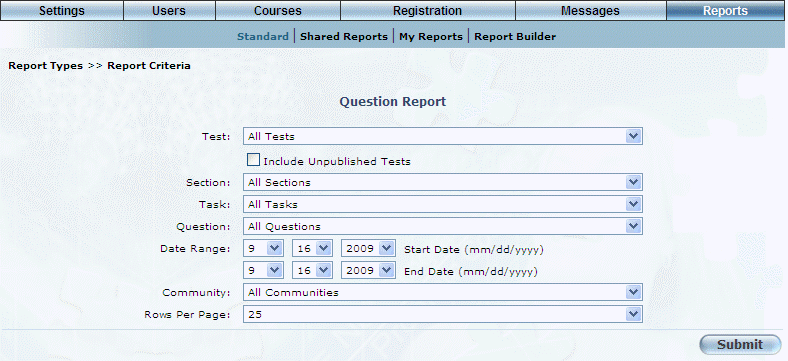
The following screen is displayed:
Question Report - Parameters
3. Use the Test drop-down list to select the test you want to include in your results.
4. Check the Include Unpublished Tests box to include unpublished tests in your results.
5. Use the Section drop-down list to select the section you want to include in your report.
6. Use the Task drop-down list to select the task you want to include in your report.
7. Use the Question drop-down list to select the question you want to include in your report.
8. Use the Date Range - Start Date and End Date drop-down lists to specify the date range of your report results.
9. Use the Community drop-down list to displays results based on users within a selected community.
10. Use the Rows Per Page drop-down list to indicate the maximum number of records you want displayed per screen.
11. Click Submit.
The following screen is displayed:
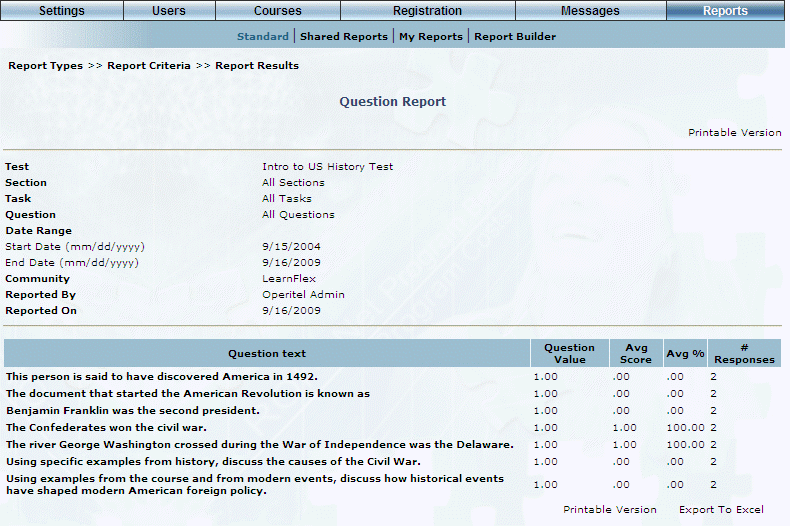
Question Report - Results
This screen displays the results of your report. The following columns of information are displayed:
· Question Text: Displays the text of each question in the text.
· Question Value: Displays the value assigned to each question.
· Avg Score: Displays the average score of each question, based on all responses.
· Avg %: Displays the average percentage of each question, based on all responses.
· # Responses: Indicates the number of responses per questions.
12. You can perform the following operations from this screen:
· Click Printable Version to view a version of the report that you can print.
· Click Export to Excel to export your results to a Microsoft Excel spreadsheet.