Introduction
This report provides a percentage breakdown of the average number of logins, successful logins, failed logins, and unique user logins for each hour between the hours of 08:00 and 22:00, and also summarizes the total number of logins, successful logins, failed logins, unique user logins, active users, and registered users.
Note: The link to this report is displayed when security setting 141: Login Summary Report is enabled.
Procedure
1. From the Reports menu, select Standard, then System Reports.
2. Click Login Summary Report.
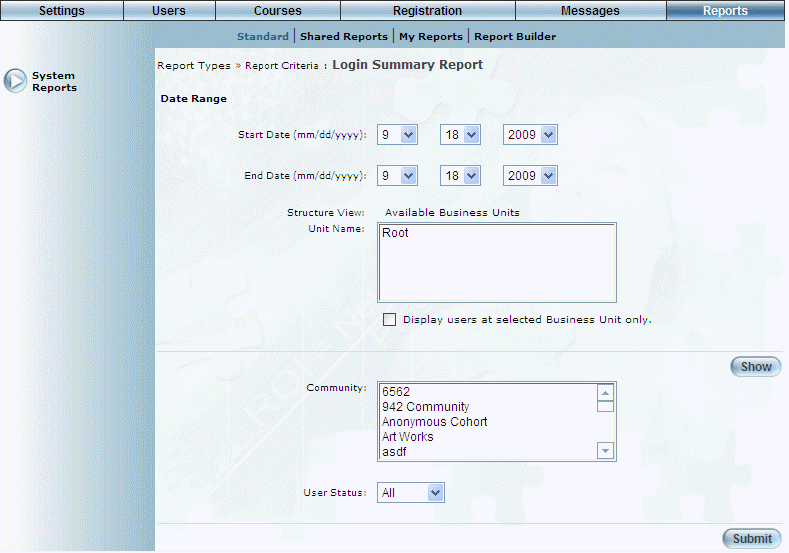
The following screen is displayed:
Login Summary Report Parameters
3. Use the Date Range - Start Date and End Date drop-down lists to specify the date range of your report results.
4. Use the Structure View link to navigate to the business units you want to include in the report.
You can:
· In the Unit Name box, select a business unit, then click Show to view the business units within the selected one. You can continue this process until you access the one you want to manage.
· Click either the Root or a business unit link in the Structure View section to return to that business unit.
The business units within the Unit Name box will be the ones included in the report.
5. Check the Display users at Selected Business Unit only box to display only those users within the selected business unit only.
6. Use the Community list box to view users in one or more communities.
7. Use the User Status drop-down list to specify if you want to include only active users, inactive users, or both.
8. Click Submit.
The results of the report are displayed:
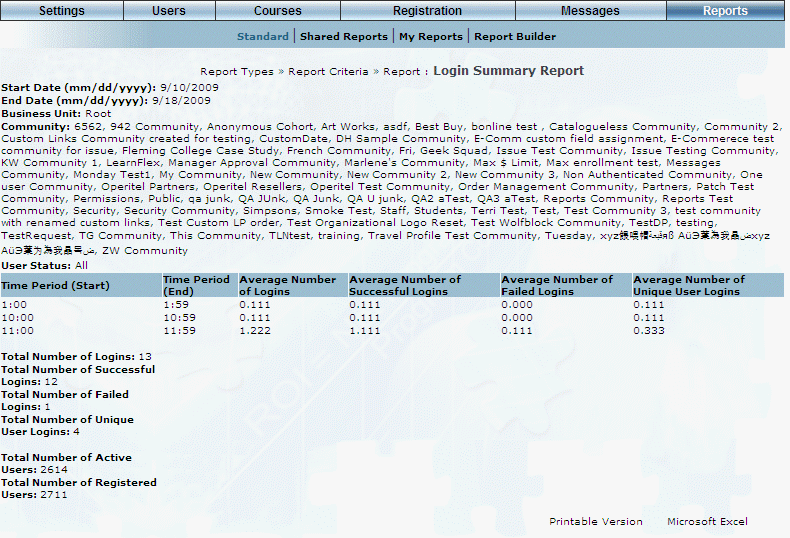
Login Summary Report Results
This screen displays the results of your report. The following columns of information are displayed:
· Time Period (Start): Displays the time when the user logged in.
· Time Period (End): Displays the tie when the user logged out of the LearnFlex session.
· Average Number of Logins: Indicates the average number of times that the user attempted to log into the session.
· Average Number of Successful Logins: Indicates the average number of times that the user successfully logged into the session.
· Average Number of Failed Logins: Indicates the average number of times that the user unsuccessfully attempted to log into the session.
· Average Number of Unique User Logins
9. You can perform the following operations from this screen:
· Click Printable Version to view a version of the report that you can print.
· Click Microsoft Excel to export your results to a Microsoft Excel spreadsheet.